DFIR-IRIS: A Case Management Platform Built for How IR Actually Works
Most IR teams have a coordination problem they don’t fully acknowledge until it costs them. The incident fires, analysts start pulling threads from different directions, and the investigation state lives across a Slack channel, a shared drive folder, someone’s personal OneNote, and three email chains. By the time you’re writing the post-incident review, you’re reconstructing the timeline from memory and chat logs instead of from organized case data.
This is the problem that a dedicated IR case management platform solves. Not a SOAR. Not a ticketing system adapted for IR. A platform designed around how incident response investigations actually work: multiple analysts, multiple evidence types, a timeline that builds over days or weeks, and deliverables that require clean chain of custody documentation.
DFIR-IRIS is the tool I use operationally for this. It’s open source, deployable in regulated environments, and built specifically for the DFIR workflow. This post covers what it does, how to structure your casework in it, and where it fits in a mature IR program.
Why a Generic Ticket Doesn’t Cut It
Before getting into IRIS specifics, it’s worth being precise about why ServiceNow or Jira fall short for IR casework.
Generic ticketing systems are designed around task tracking and workflow routing. They handle status, assignment, and escalation well. What they don’t handle is the investigative structure of an IR case: the relationship between a compromised asset and an observed IOC, the chronological reconstruction of attacker behavior across multiple evidence sources, the chain of custody for a forensic image, or the note-taking workflow where an analyst is simultaneously collecting and interpreting evidence.
When you adapt a ticket for IR, you end up with a long free-form description field that becomes a dumping ground, attachments with no context, and a timeline that exists nowhere because the system has no concept of one. The investigation state is in people’s heads, not in the tool.
For low-severity incidents handled by one analyst in an hour, that’s probably fine. For a multi-analyst investigation running across a week with a ransomware actor still potentially active in the environment, it’s a meaningful operational liability.
What DFIR-IRIS Is
DFIR-IRIS (the project lives at github.com/dfir-iris/iris-web) is an open-source, web-based incident response and case management platform. It’s built in Python/Flask, deploys via Docker, and is designed for collaborative investigations where multiple analysts are working the same case simultaneously.
The platform structures an investigation around a set of core objects that map directly to how IR work actually happens:
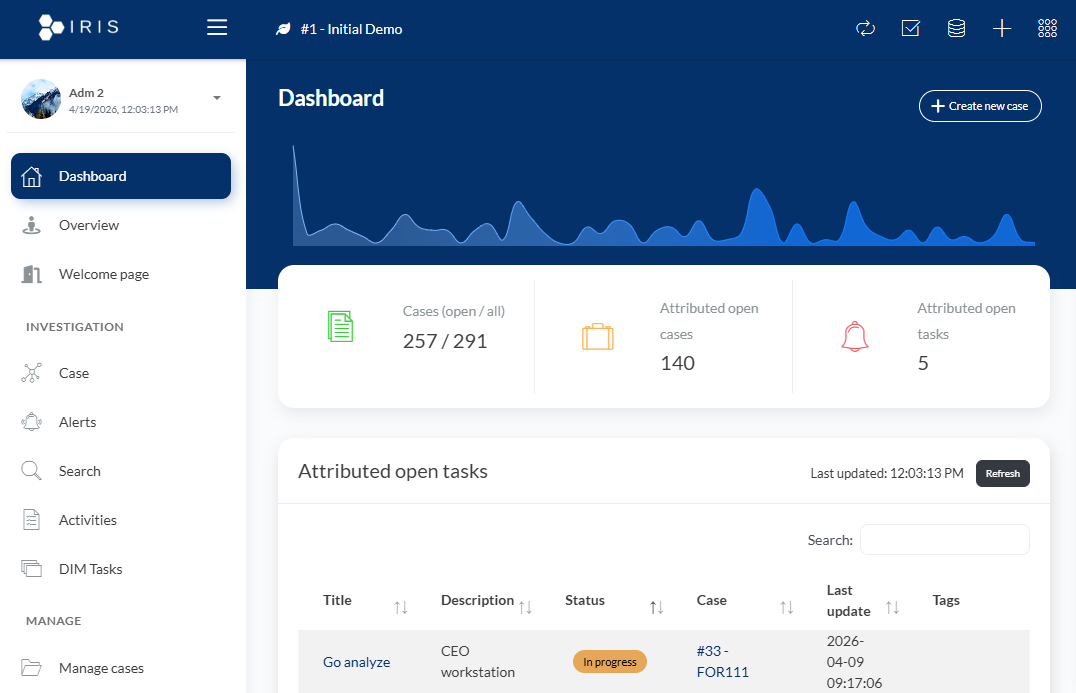
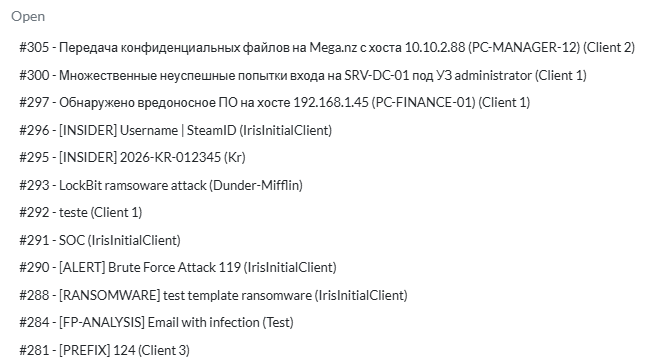
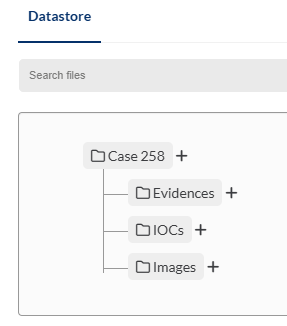
Cases are the top-level container. A case has a classification, a severity, a timeline range, assigned analysts, and a status. Every other object in IRIS belongs to a case.
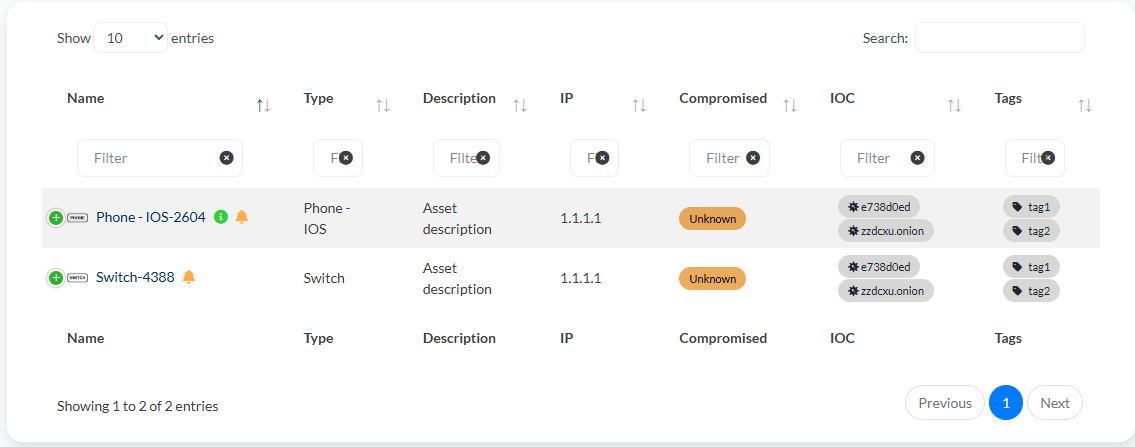
Assets are the hosts, accounts, or services involved in the incident. You’re not just listing “DESKTOP-WORKSTATION-01” in a description field. You’re creating an asset record with a type, a compromise status (compromised, likely compromised, to analyze, not compromised), associated tags, and a link to the timeline events that involve that asset. When a case involves twelve hosts and you’re trying to scope which ones are confirmed versus suspected, this structure matters.
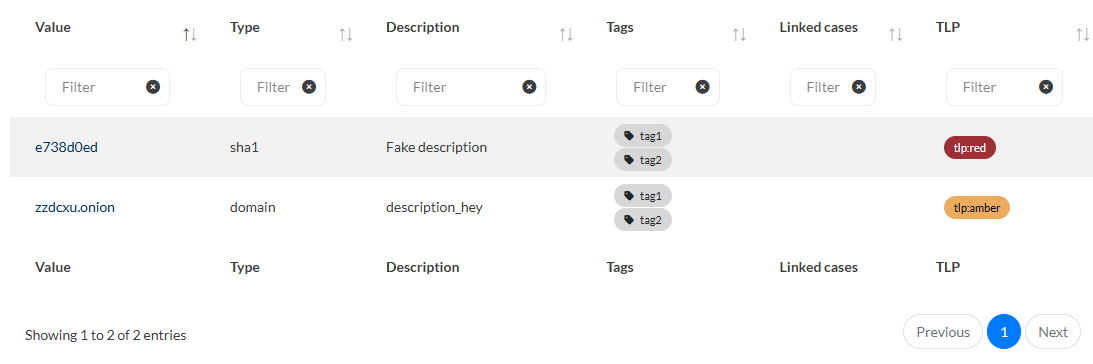
IOCs (Indicators of Compromise) are tracked with type classification (IP, domain, hash, URL, etc.), TLP markings, and relationship to case assets. The MISP integration I’ll cover below lives here.
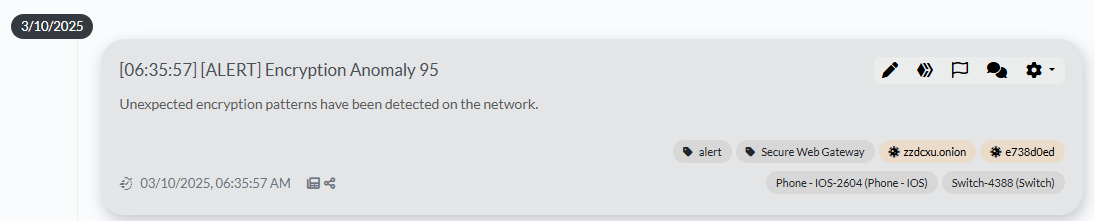
The Timeline is where the investigation narrative actually lives. Each event on the timeline has a date and time, a source (Sysmon, CloudTrail, Zeek conn.log, EDR telemetry — whatever you’re working from), a description, associated assets, associated IOCs, and a color-coded category. A properly built IRIS timeline at the end of an investigation is the backbone of your IR report. The executive summary writes itself off of it.
Evidence tracks forensic artifacts: disk images, memory captures, log exports, PCAP files. Each evidence entry includes acquisition timestamps, analyst who collected it, storage location, and a hash for integrity verification. This is your chain of custody documentation.
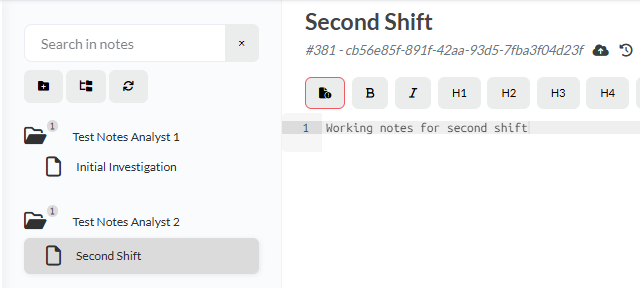
Notes are a collaborative notebook within the case. Multiple analysts can write concurrently. This is where hypothesis tracking, analytical observations, and investigative dead-ends should live; not in Slack or Jira.
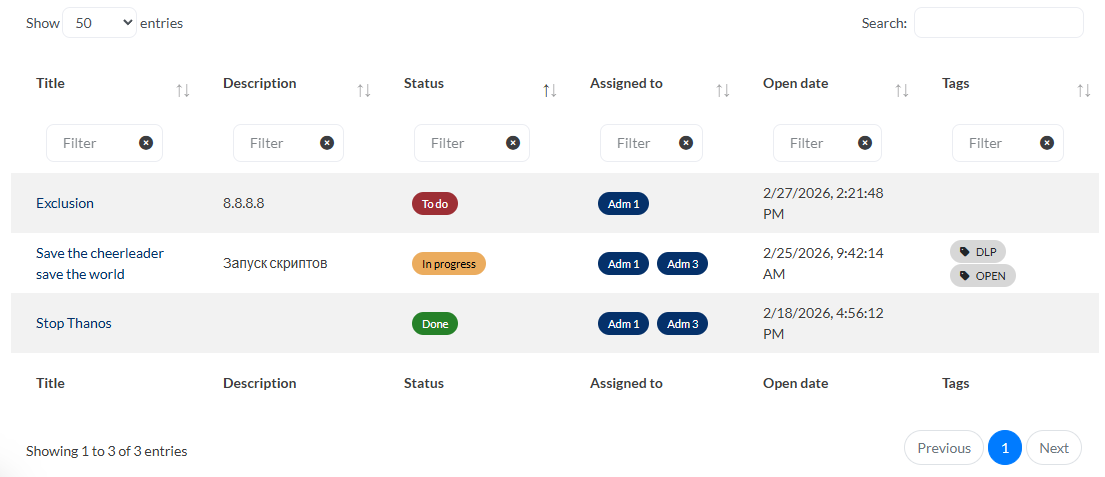
Tasks are the action item layer: what needs to happen, who owns it, and what the status is. Containment actions, evidence requests, notification drafts.
Workflow Example: Ransomware Investigation
This is what IRIS case structure looks like in practice during a ransomware response.
Case creation: The case goes up immediately when the incident is declared. Classification: Intrusion. Severity: High. Assigned analysts: IC, Lead Analyst, etc. Start date populated.
Initial assets: The first confirmed encrypted host becomes an asset. Status: Compromised. As scoping expands, assets are added with appropriate status. By the end of triage, you have a visual account of the spread — what’s confirmed, what’s suspected, what’s cleared.
Timeline build as evidence comes in:
You’re pulling VSS deletion events from the System event log (Event 524), encryptor entries from Task Scheduler, lateral movement artifacts from Zeek smb_files.log and Windows Event 4648. Each of those becomes a timeline entry with the appropriate timestamp, source reference, and linked assets. When a second analyst is pulling Zeek logs while you’re working EDR telemetry, both of you are adding to the same timeline in real time. At the end of the session, the timeline reflects the full investigative picture rather than two separate notebooks you have to reconcile later.
IOC tracking: C2 domains pulled from memory forensics, file hashes for the encryptor, the Rclone binary hash, the staging directory path. These go into IOCs so they can be pushed to your detection stack and threat intel platform.
Evidence entries: The memory image captured from the compromised host, the EDR triage export, the Zeek log archive. Each gets an entry with hash and acquisition metadata.
Tasks: “Notify legal of potential data exposure,” “Confirm backup integrity for affected systems,” “Submit IOCs to MISP,” “Draft executive SITREP by 1800.”
When the incident is resolved and you’re writing the post-incident review, you’re not reconstructing the timeline from memory. You’re exporting it.
MISP Integration
IRIS has a native MISP integration that closes the loop between case IOCs and your threat intelligence platform. The integration works bidirectionally: you can push IOCs from an IRIS case directly to a MISP event, and you can pull from MISP into an IRIS case during the investigation.
In practice, the workflow during a case looks like this: you’ve extracted a C2 domain from memory or Zeek ssl.log. You add it as an IOC in IRIS, set the TLP, and push to MISP. From MISP, your detection feeds pick it up and it goes into your SIEM and EDR block lists (provided you have automations configured). If you’re operating in a shared environment or have a sector ISAC relationship, MISP handles the distribution.
For teams running both IRIS and MISP, this integration removes a manual step that otherwise involves copy-pasting indicators between two systems during an active investigation. Which is exactly the kind of operational friction that causes indicators to fall through the cracks.
Deployment in Regulated Environments
IRIS deploys via Docker Compose, which makes it straightforward to run on-premises or in a private cloud environment. For teams operating in CMMC Level 2/3 or FedRAMP environments, this matters. You’re not routing case data through a commercial SaaS platform that may or may not be authorized under your boundary.
The entire application stack (the Flask application, Postgres database, RabbitMQ for task queuing, and Nginx) runs containerized. A basic deployment with persistent storage is achievable in under an hour if you have Docker experience. For regulated environments, the relevant questions are around database backup, access logging, authentication (IRIS supports LDAP integration for centralized auth), and network segmentation from your general enterprise environment.
The REST API is fully documented and allows integration with your broader toolchain. If you’re running a SOAR, you can push enrichment data or case updates programmatically without touching the UI.
Where IRIS Fits in the IR Toolchain
IRIS is not a SOAR, and it’s not trying to be. Automated enrichment, alert triage queues, and playbook-driven automation live in Splunk SOAR, Sentinel Logic Apps, or XSOAR. IRIS handles the investigative case record: the thing that a human analyst is actively building during the investigation and that needs to produce a defensible, exportable record at the end.
The workflow integration looks like this: an alert fires in your SIEM, gets triaged, and gets escalated to a declared incident. The incident gets an IRIS case. From that point forward, the IRIS case is the authoritative investigation record. Your SOAR is handling enrichment automation. Your SIEM is where you’re building detection queries. IRIS is where the investigative state lives.
For teams that have historically relied on shared drives and ticketing systems for this function, the value is most visible the first time you run a complex multi-day investigation and realize that any analyst joining the case on day three can open IRIS, read the timeline and notes, and be productive within fifteen minutes — rather than spending an hour chasing down the lead analyst to get a verbal brief.
The Practical Step
If you don’t have a dedicated IR case management platform: set up IRIS in a lab environment before you need it in an incident. The Docker deployment documentation is thorough. Get familiar with the case structure, build a few mock cases around scenarios your team actually responds to, and decide how it maps to your existing IR workflow before the pressure is on.
If you’re already running IRIS and not using the timeline systematically — not treating every timestamped piece of evidence as a timeline entry with a source reference — you’re getting a fraction of its value. The timeline is the most important object in the platform. Build the habit of populating it in real time, not as a retrospective cleanup task.
The IRIS GitHub repository is at github.com/dfir-iris/iris-web. Documentation lives at docs.dfir-iris.org.